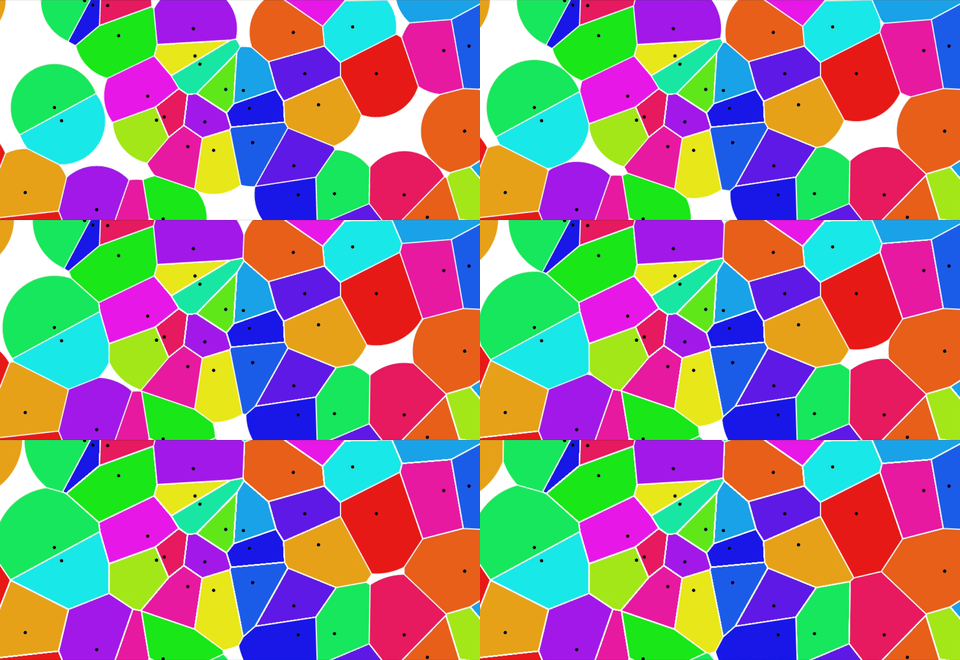
The Problem
At work, we deal with a truck load of data. And if you are into visualizing a truck load of data, you should know that it can take any form. The problem we were facing was that our UX for graphs had 2 major pain points when our users would try to hover over BigData graphs.
- Selecting a dot which is only a few pixels in size is a pain
- And if these dots are too close, all hell starts breaking lose

Usually, UX designers are coaxed into making the diameter of these dots bigger so there's enough area for interaction. Or the UI Engineers end up making hacky ways to create an invisible interactive area over these tiny dots like an invisible <rect> or a bigger <circle> over each dot so that the pointer gets enough surface area for interaction.
That is a pretty standard hack to deal with cases like these. But we did not want to do that. Because we could foresee that the hacks fail when there are multiple data series running through the plane. Small hacks have their place and must be used.
We wanted to think bigger.
Voronoi Diagrams
Voronoi diagrams tells us the minimum distance to reach a point on a spatially distributed data. It was originally introduced Russian mathematician Georgy Voronoy.

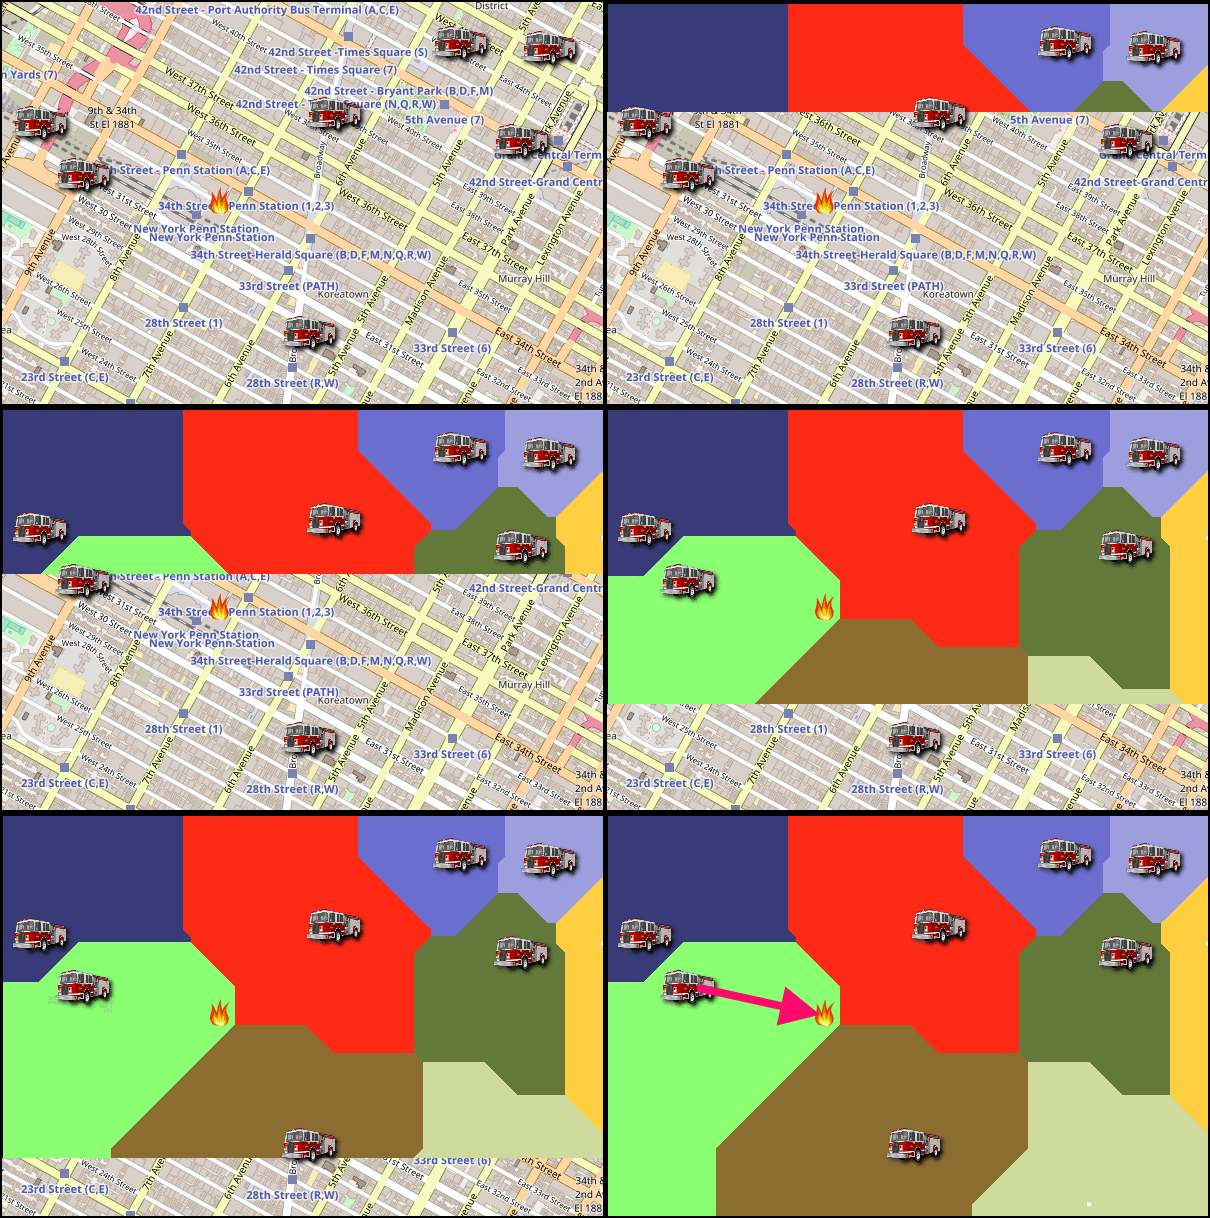
Let's take an example of this gif of firetrucks I pulled from coding game's post

Drawing vooronoi cells here would would help us find which firetruck is the nearest one to the fire (really interesting article by the way). When I stumbled upon this post, I realized that the approach to the solution was simple:
The fire in the diagram was the user's cursor.
Let's begin.
Code
We'll be using the graph that I have attached in the beginning. Here's the codepen of the problem (it's the end result). To create the cells, we will be using the D3 Delaunay library (you could really choose any library you want. You're welcome to reinvent the wheel.. I'd rather not). This is not the whole code though.
We will be needing a list of arrays of coordinates (coords) and a list of array of dataPoints (allDatapoints). A list of array of datapoints only to support multiple lines.
The voronoi variable is the object made by Delauney which will be storing different methods such has hull, triangles, neighbors, etc. We are particularly interested in the render function.
Now, we can tell d3 to create invisible paths and attach event handlers on each path.
Done!

Conclusion
This obviously needs more refactors. But this gives you the base to dispatch whatever actions you want. We decided to have a hovering <circle> which snapped to the points and further added click handlers which dispatched actions to our redux store.

We no longer use d3's convention of rendering graphs for better perf and code maintainance. I will soon write an extensive post on that soon.
Until then, see you around! Cheers!